Abstract
When are two collider events similar? Despite the simplicity and generality of this question, there is no established notion of the distance between two events. To address this question, we develop a metric for the space of collider events based on the earth mover’s distance: the “work” required to rearrange the radiation pattern of one event into another. We expose interesting connections between this metric and the structure of infrared- and collinear-safe observables, providing a novel technique to quantify event modifications due to hadronization, pileup, and detector effects. We showcase how this metrization unlocks powerful new tools for analyzing and visualizing collider data without relying upon a choice of observables. More broadly, this framework paves the way for data-driven collider phenomenology without specialized observables or machine learning models.
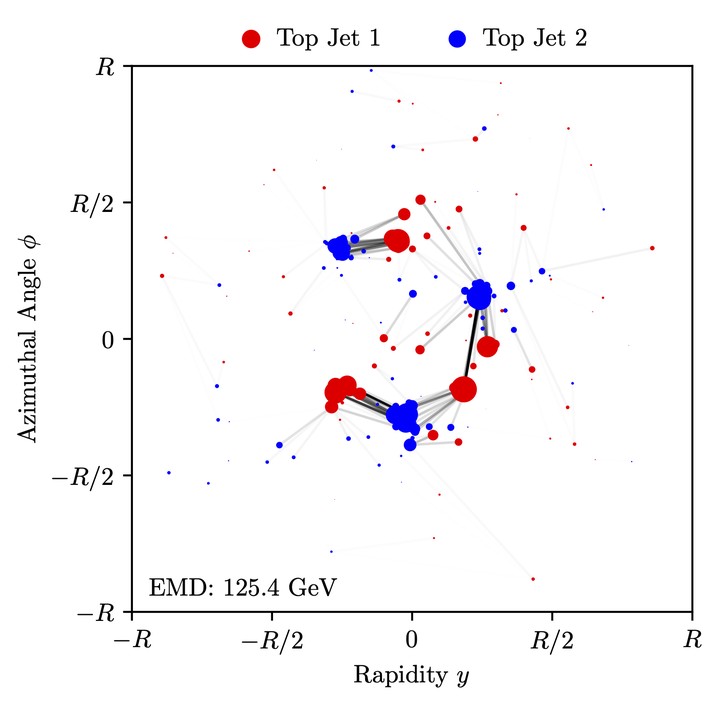
Figure 1: Optimal rearrangement of one top-quark jet (red) into another (blue). Particles are represented as points in the rapidity-azimuth plane with area proportional to their transverse momenta. Darker lines indicate greater movement of energy. The Energy Mover’s Distance (EMD) is the total amount of energy moving or “work” required to perform the rearrangement.
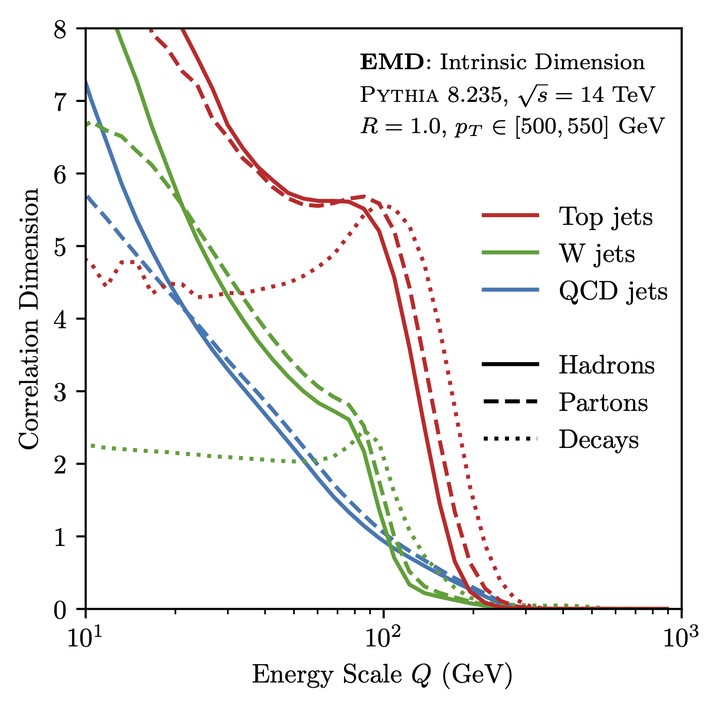
Figure 4: The correlation dimension as a function of energy scale for top-quark, W-boson, and QCD-initiated jets at hadron, parton, and decay (for tops and Ws) levels. The correlation dimension is a measure of the dimensionality of the space that the jets live in when viewed by the EMD with a resolution determined by the energy scale. The fractal nature of jets is consistent with the increase in the correlation dimension at smaller scales. The fact that the top and W decay lines go to approximately 5 and 2, respectively, at small scales can be predicted from simple kinematic arguments. The effect of hadronization can be seen in that the hadron lines peel upward from the parton lines at the tens of GeV scale. Altogether, this plot captures an astonishing amount of physics in a simple and intuitive quantity.